Built to order
What should this part actually cost?
Most sourcing teams find out what a part costs by asking a supplier. That gives you a price, not a cost — and no way to tell whether the price is fair, or where the money in it is going.
This is a working should-cost model for machined parts. Pick a part, set the specification, and it builds the cost from the process up — stock, cycle time, setups, tooling, inspection, yield, freight — then sets it against the supplier's quote. Every number is computed live. Nothing is looked up from a table of averages.
The parts and rates here are illustrative. They are representative samples and regional defaults, not a customer's parts and not anyone's supply base. Uncalibrated, a should-cost is a triage tool: good for finding which lines deserve a hard look, not for setting a target price. The range is the answer, not the midpoint.
Unit cost against lot size
Cost per piece across the candidate routings
| Lot size | Should-cost | Range | Best routing | Supplier quote | Gap |
|---|
Cost teardown
Per piece at the selected lot size
What moves the number
Change in unit cost if one input moves, everything else held
Reduces cost Increases cost
Against the quote
Supplier price break against modeled cost
—
per piece
What comes out
The real one reads the part's STEP file, measures the solid — volume, surface, holes, setups — and writes this: the teardown, every routing across every lot size, what moves the number, and the quote set against it. This is its report for a sample block with four holes, exactly as it prints.
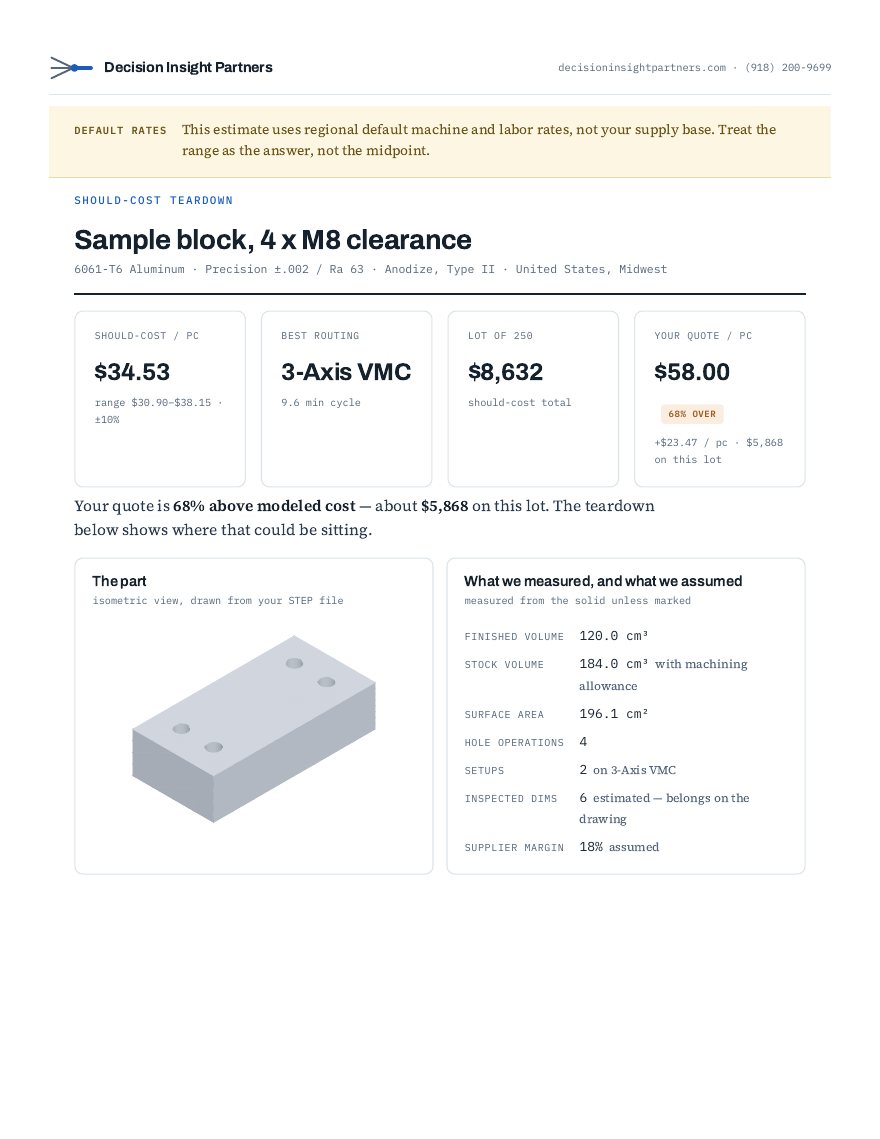
Three pages: the answer and the gap first, then what was measured and what was assumed, then the curve, the teardown and the lot-size table.
It comes from the program's own model, not this page's — and the two are tested against the same published numbers, so they cannot quietly disagree.
How to read the curve
The kinks are the point
Each routing carries different fixed cost — programming, fixtures, hard tooling — and a different cycle time, so no single process is cheapest everywhere. The blue line traces the cheapest routing at every lot size, and the labels along the top show which one wins where.
A buyer who knows where their part crosses over has a question their supplier has to answer.
The band is not decoration
A should-cost stated to the penny is a should-cost nobody should trust. The shaded range is the model's honest confidence interval, and it widens exactly where it ought to — tight tolerances, difficult alloys, offshore rate assumptions, lots of one.
Take the band into the negotiation, not the midpoint.
Where quotes and costs part ways
Supplier price breaks usually stop somewhere — often at 500 or 1,000 pieces. Real cost does not stop falling there. The widening gap between the quoted step line and the modeled curve at high volume is the most common recoverable overspend we see, and it is invisible on a quote sheet.
What this model is, and what it isn't
What it does
Builds cost bottom-up from process physics: stock volume and material price, metal removal rate by alloy and machine class, hole and feature operations, setup count by routing, programming and fixture amortization, secondary operations, inspection load driven by tolerance count, scrap, supplier margin, freight and duty.
Every line is separable and arguable, which is the only kind of number that survives a conversation with a supplier.
How it gets accurate
A parametric model out of the box lands in the right neighborhood. It gets to negotiation grade by being calibrated against what you have actually paid — your own purchase order history, matched to the parts it bought.
That calibration is the work, and it is specific to your commodity, your suppliers and your region.
Read this before quoting anyone
- The parts here are representative samples, not real customer parts, and the machine and labor rates are illustrative defaults.
- An uncalibrated model is a triage tool — good for finding which lines deserve a hard look, not for setting a target price.
- Cost is driven as much by the drawing as the model — tolerances, finish callouts, material certs and inspection level.
- Duty, freight and regional rates move constantly. Treat them as inputs you own, not constants.
What the real one does
This page is the model. The program around it is what a purchasing team actually uses.
It reads the part
Hand it a STEP file and it measures the solid itself — finished and stock volume, surface area, hole operations, setups by direction — and draws the part on the report, so nobody retypes a dimension.
It ranks the pile
Point it at a folder of parts and it ranks them by what to renegotiate first, with talking points for the supplier call on each one worth calling about.
It learns what you pay
Import the quotes and prices you have actually paid and it keeps them beside the model over time, calls out price creep, and keeps its own track record of how close it lands.
It stays on your side
It runs as a program on your own computer or on your company's own server, so drawings do not have to leave the building to be costed.
Bring us the last twenty parts you bought.
Send the purchase orders and the models. We will build the should-cost on each one, show you the teardown line by line, and tell you plainly which are priced fairly and which are not. If nothing is out of line, we will tell you that too.